QUAKE Analytics transforms complex deal documents into decision-ready intelligence—reconciling financials, testing performance and valuation, identifying what matters, and producing presentation-ready results.
Upload
Bring the deal in.
Analyze
See what the numbers reveal.
Present
Make the case clear.
Upload
Secure. Private. Protected.
Your deal documents and financial data are handled with security and privacy at the forefront. Upload your OM, T-12, and rent roll with confidence knowing your information is protected.
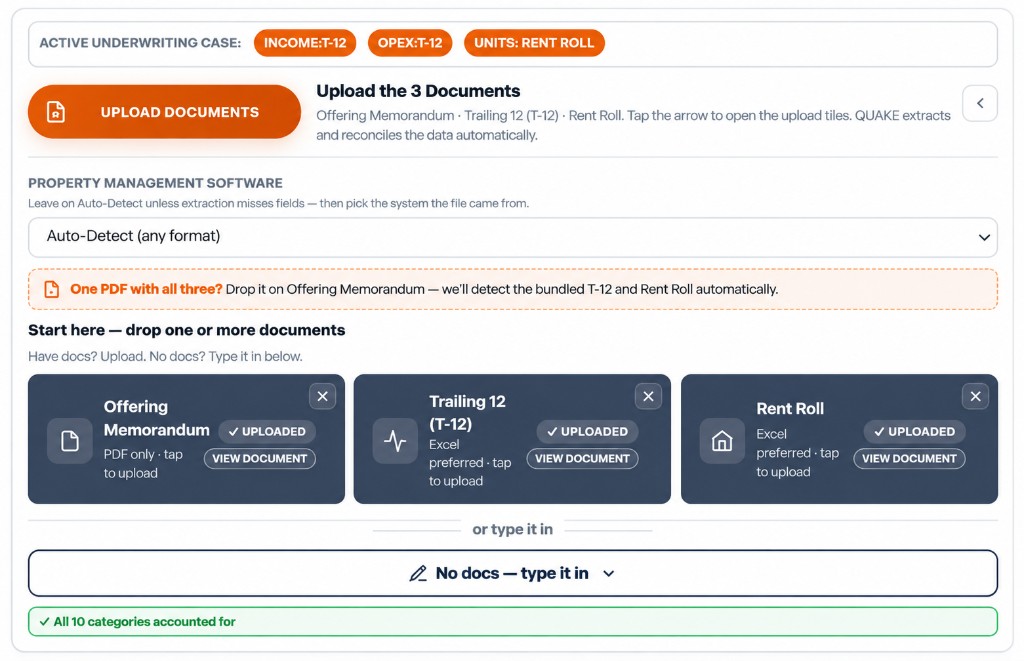
Offering MemorandumT-12Rent Roll
Analyze
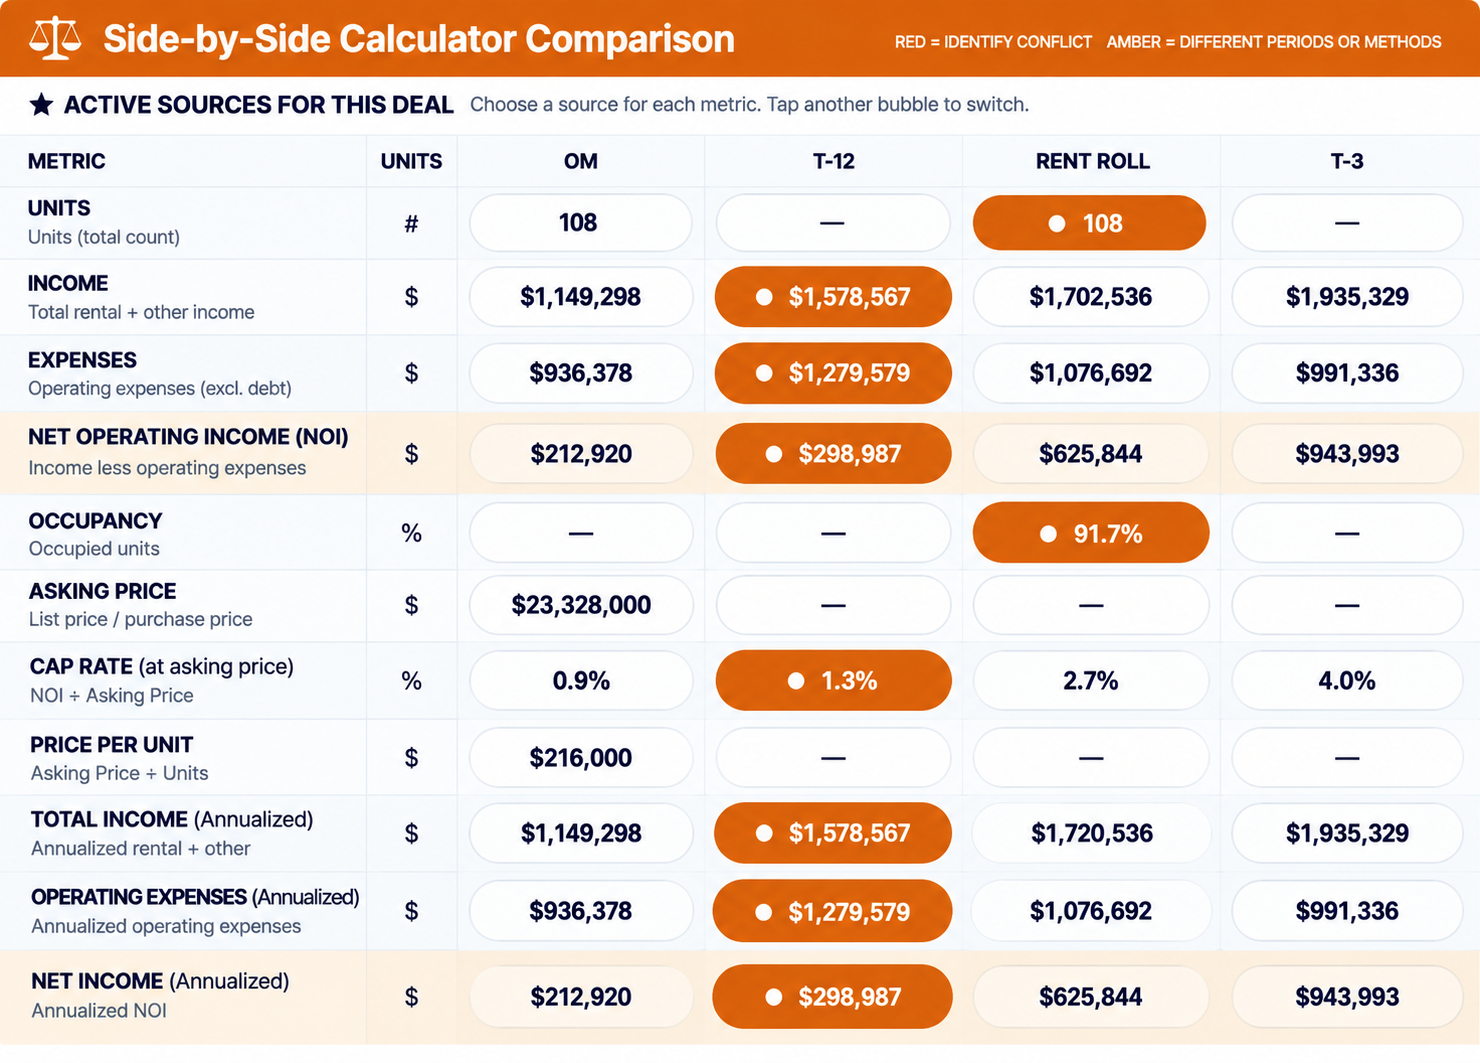
When the OM, T-12, and rent roll disagree, Quake shows you.
The offering memorandum is a story. The T-12 is the operating history. The rent roll is the current building. Quake reads all three, lines the numbers up, and marks where they diverge.
Understand
One deal. Every number. In working order.
Extraction is the start. The Deal Index holds the working file. The labs around it are how you decide.
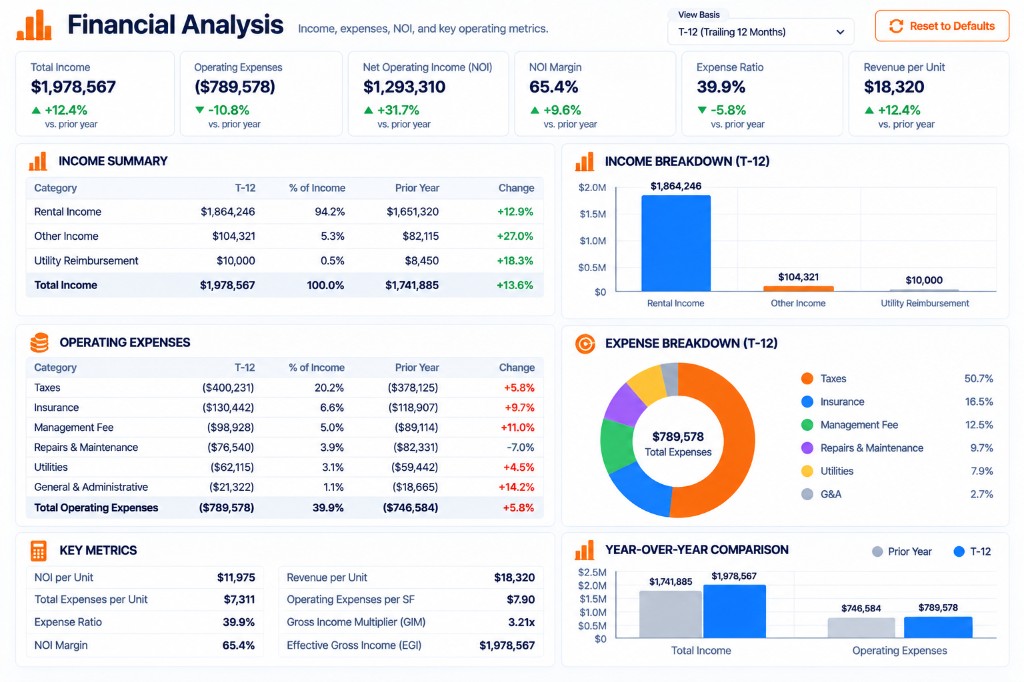
Financial Analysis
Financial Analysis
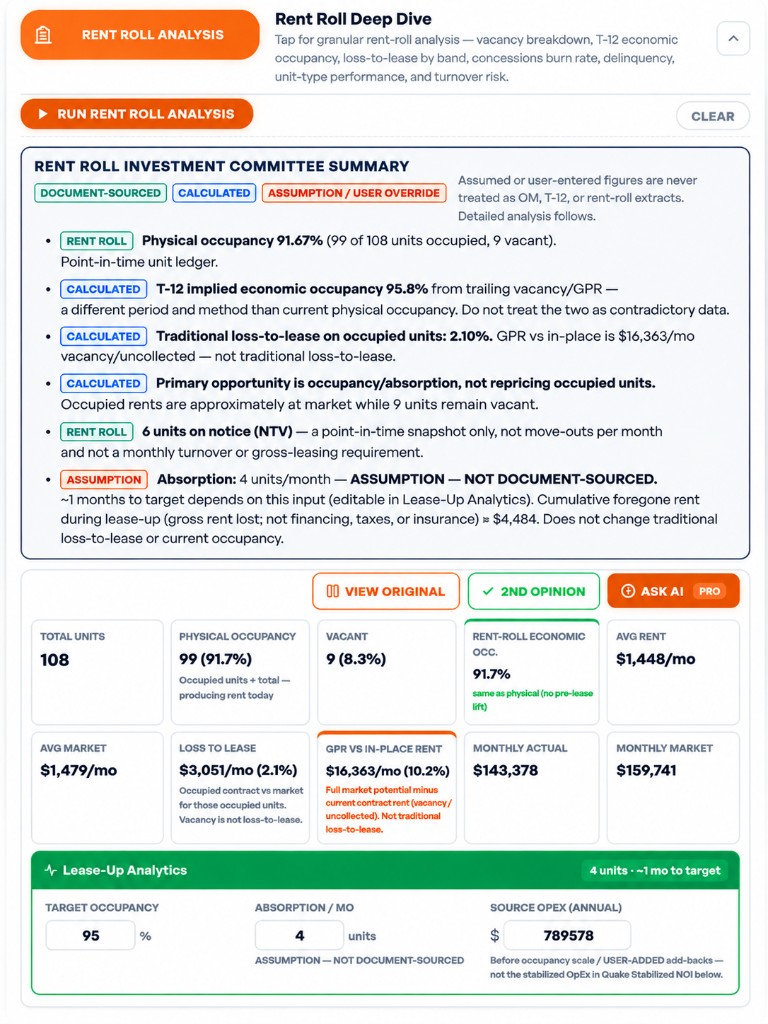
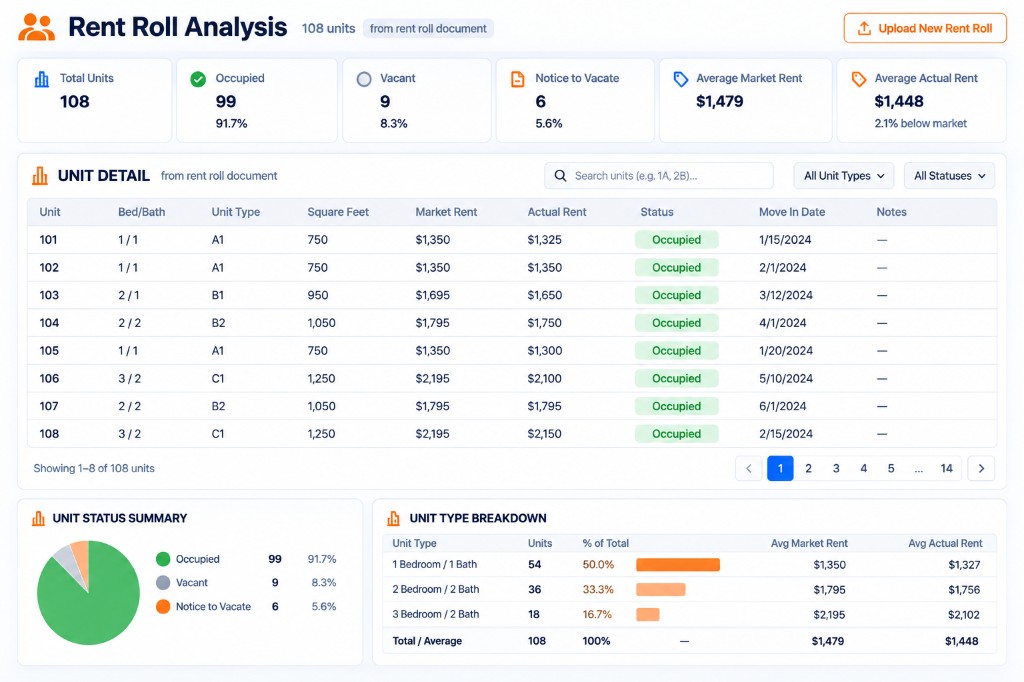
Rent Roll Analysis
Rent Roll Analysis
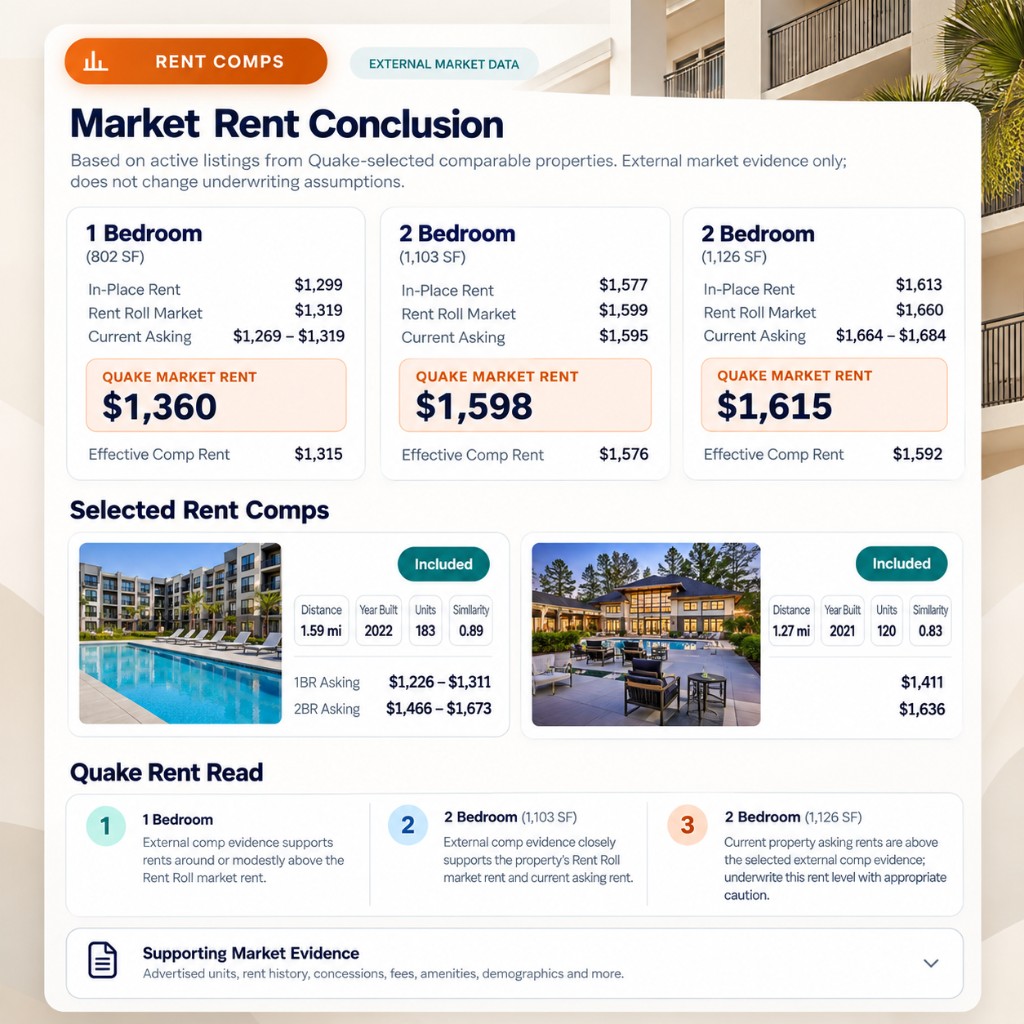
Rent Comps
Rent Comps
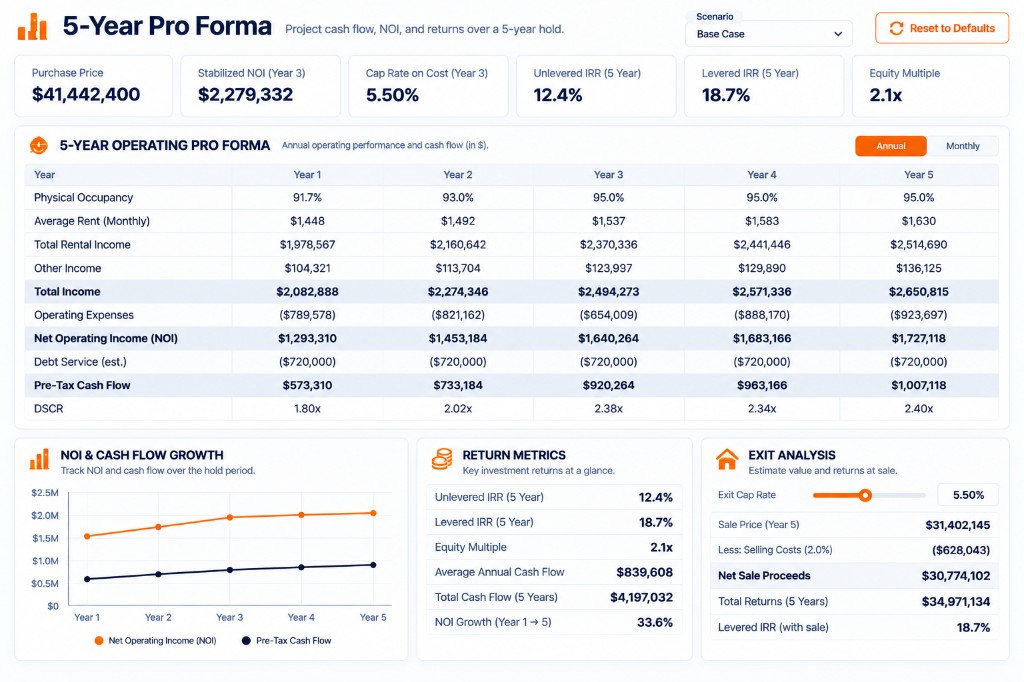
5-Year Pro Forma
5-Year Pro Forma
Present
From working file to something you can present.
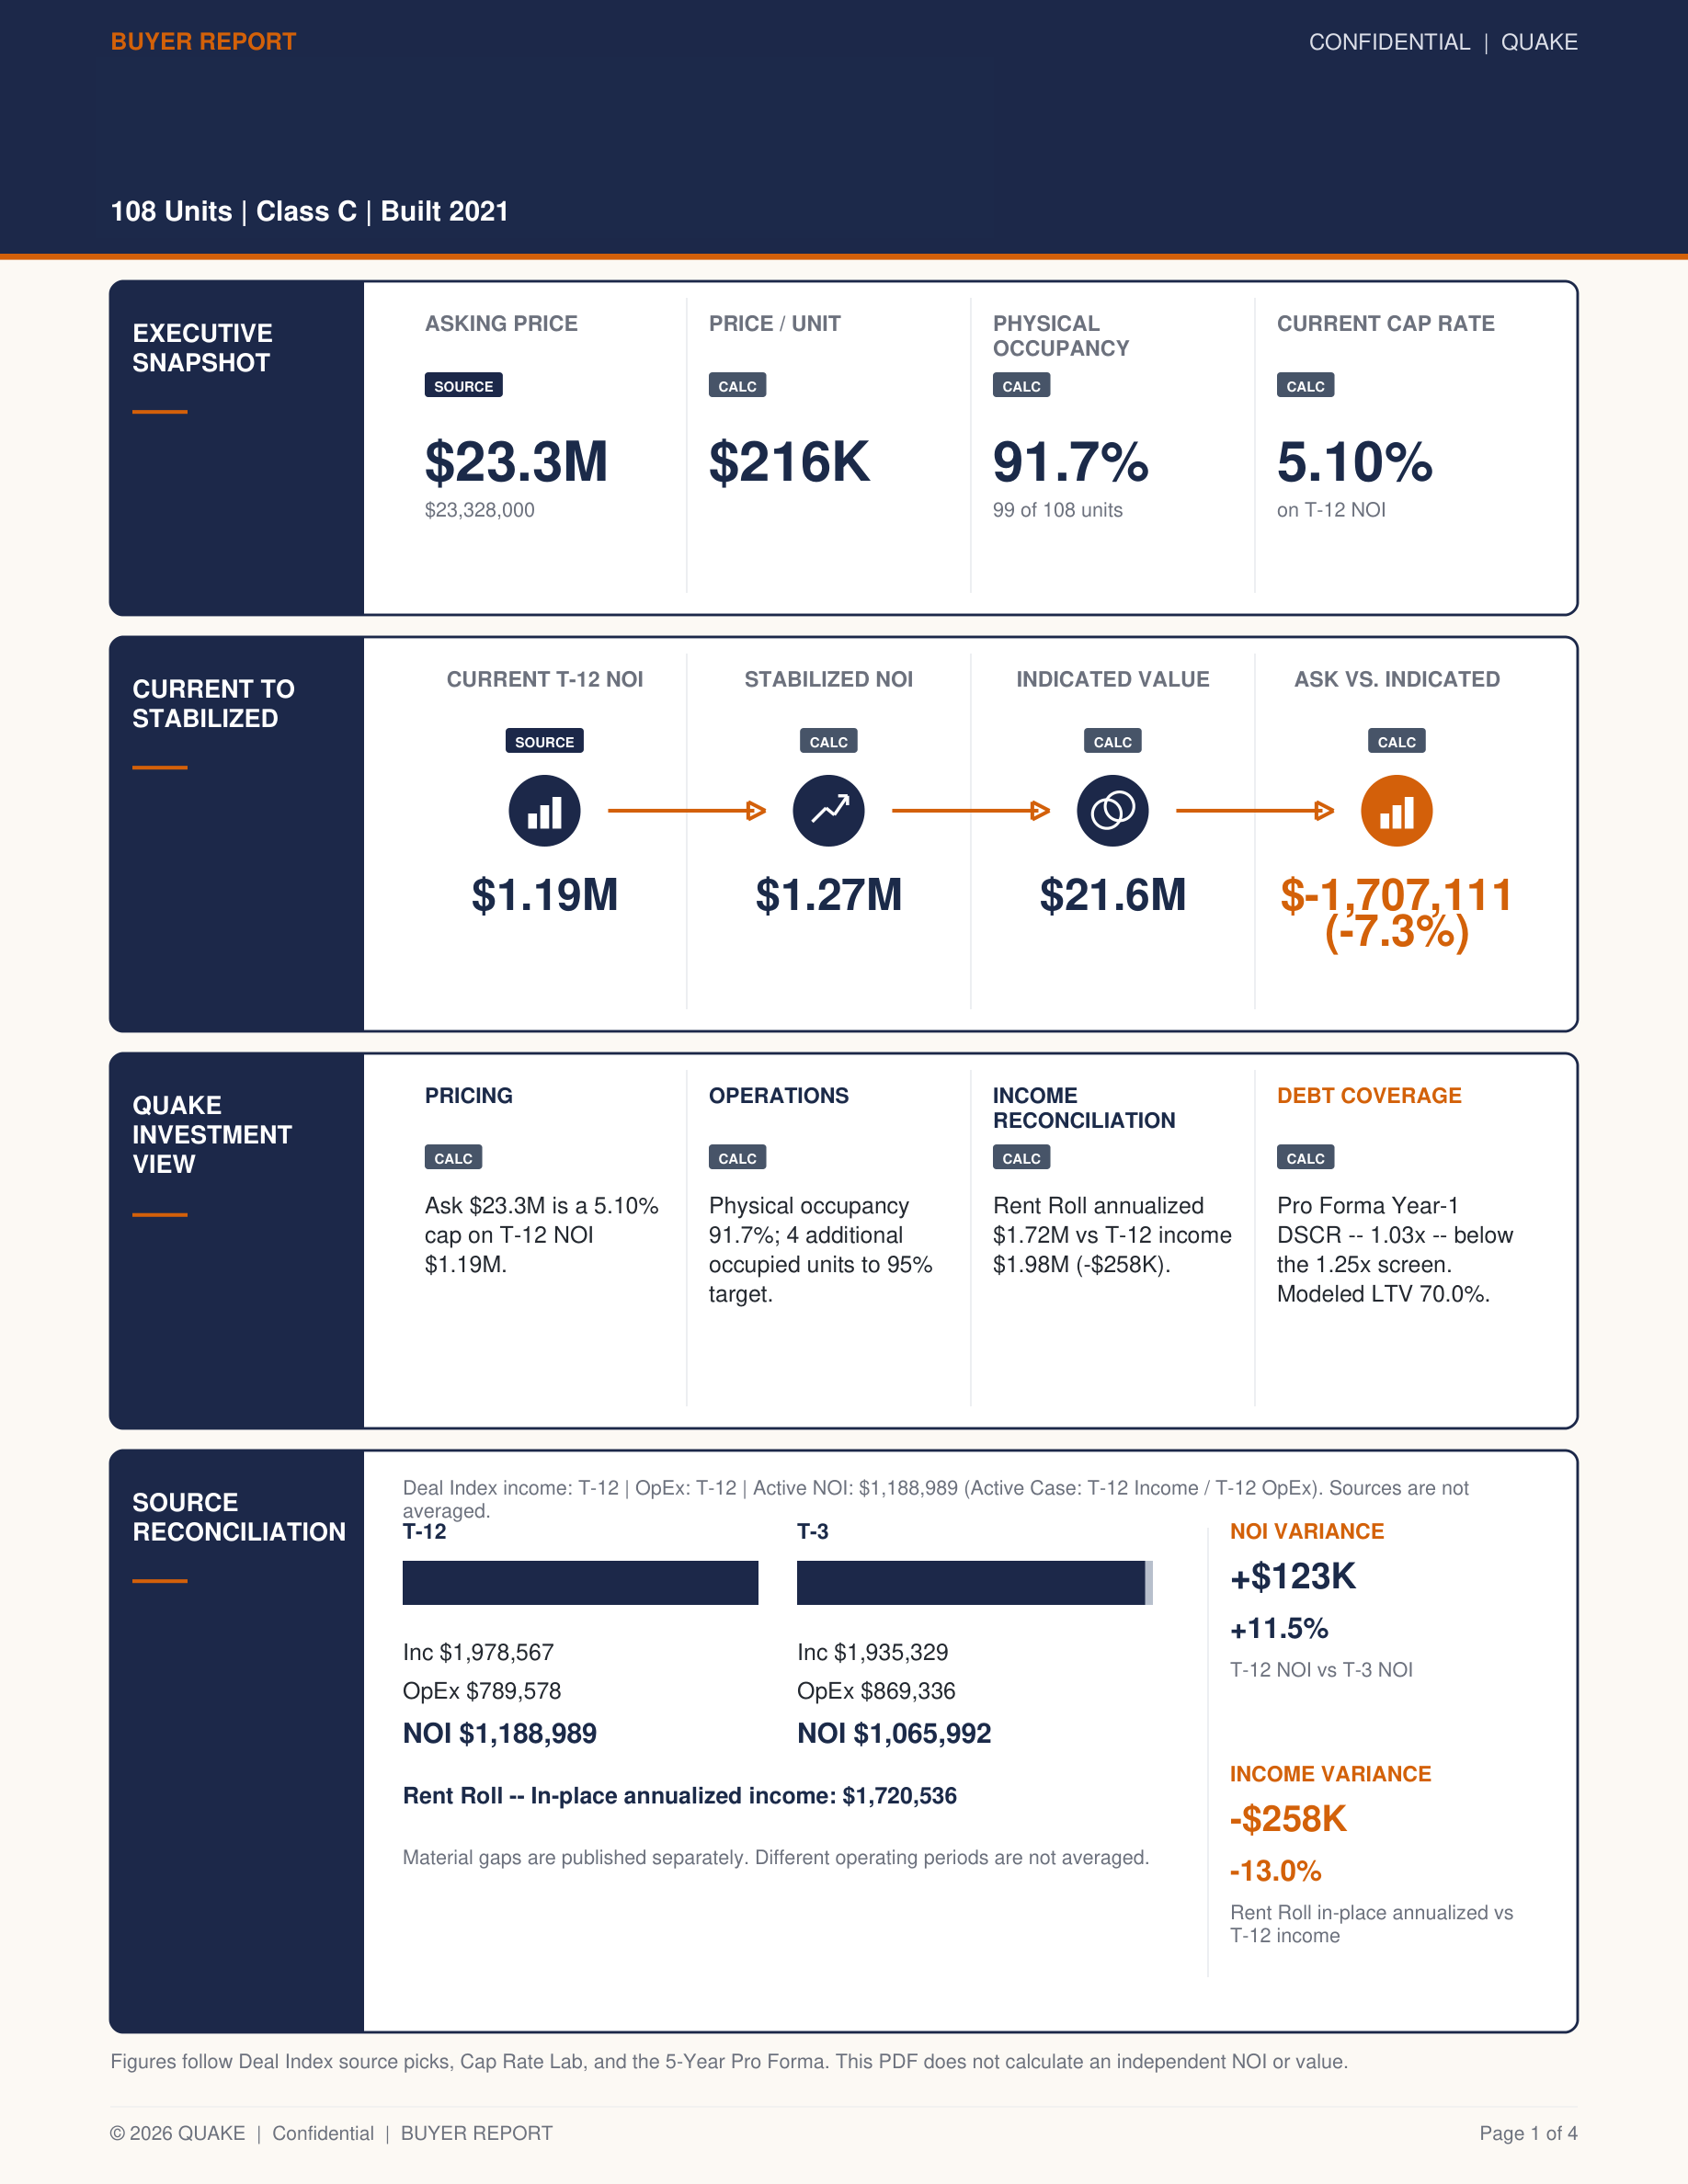
Once the deal is reconciled and analyzed, Quake produces the package from the same numbers.
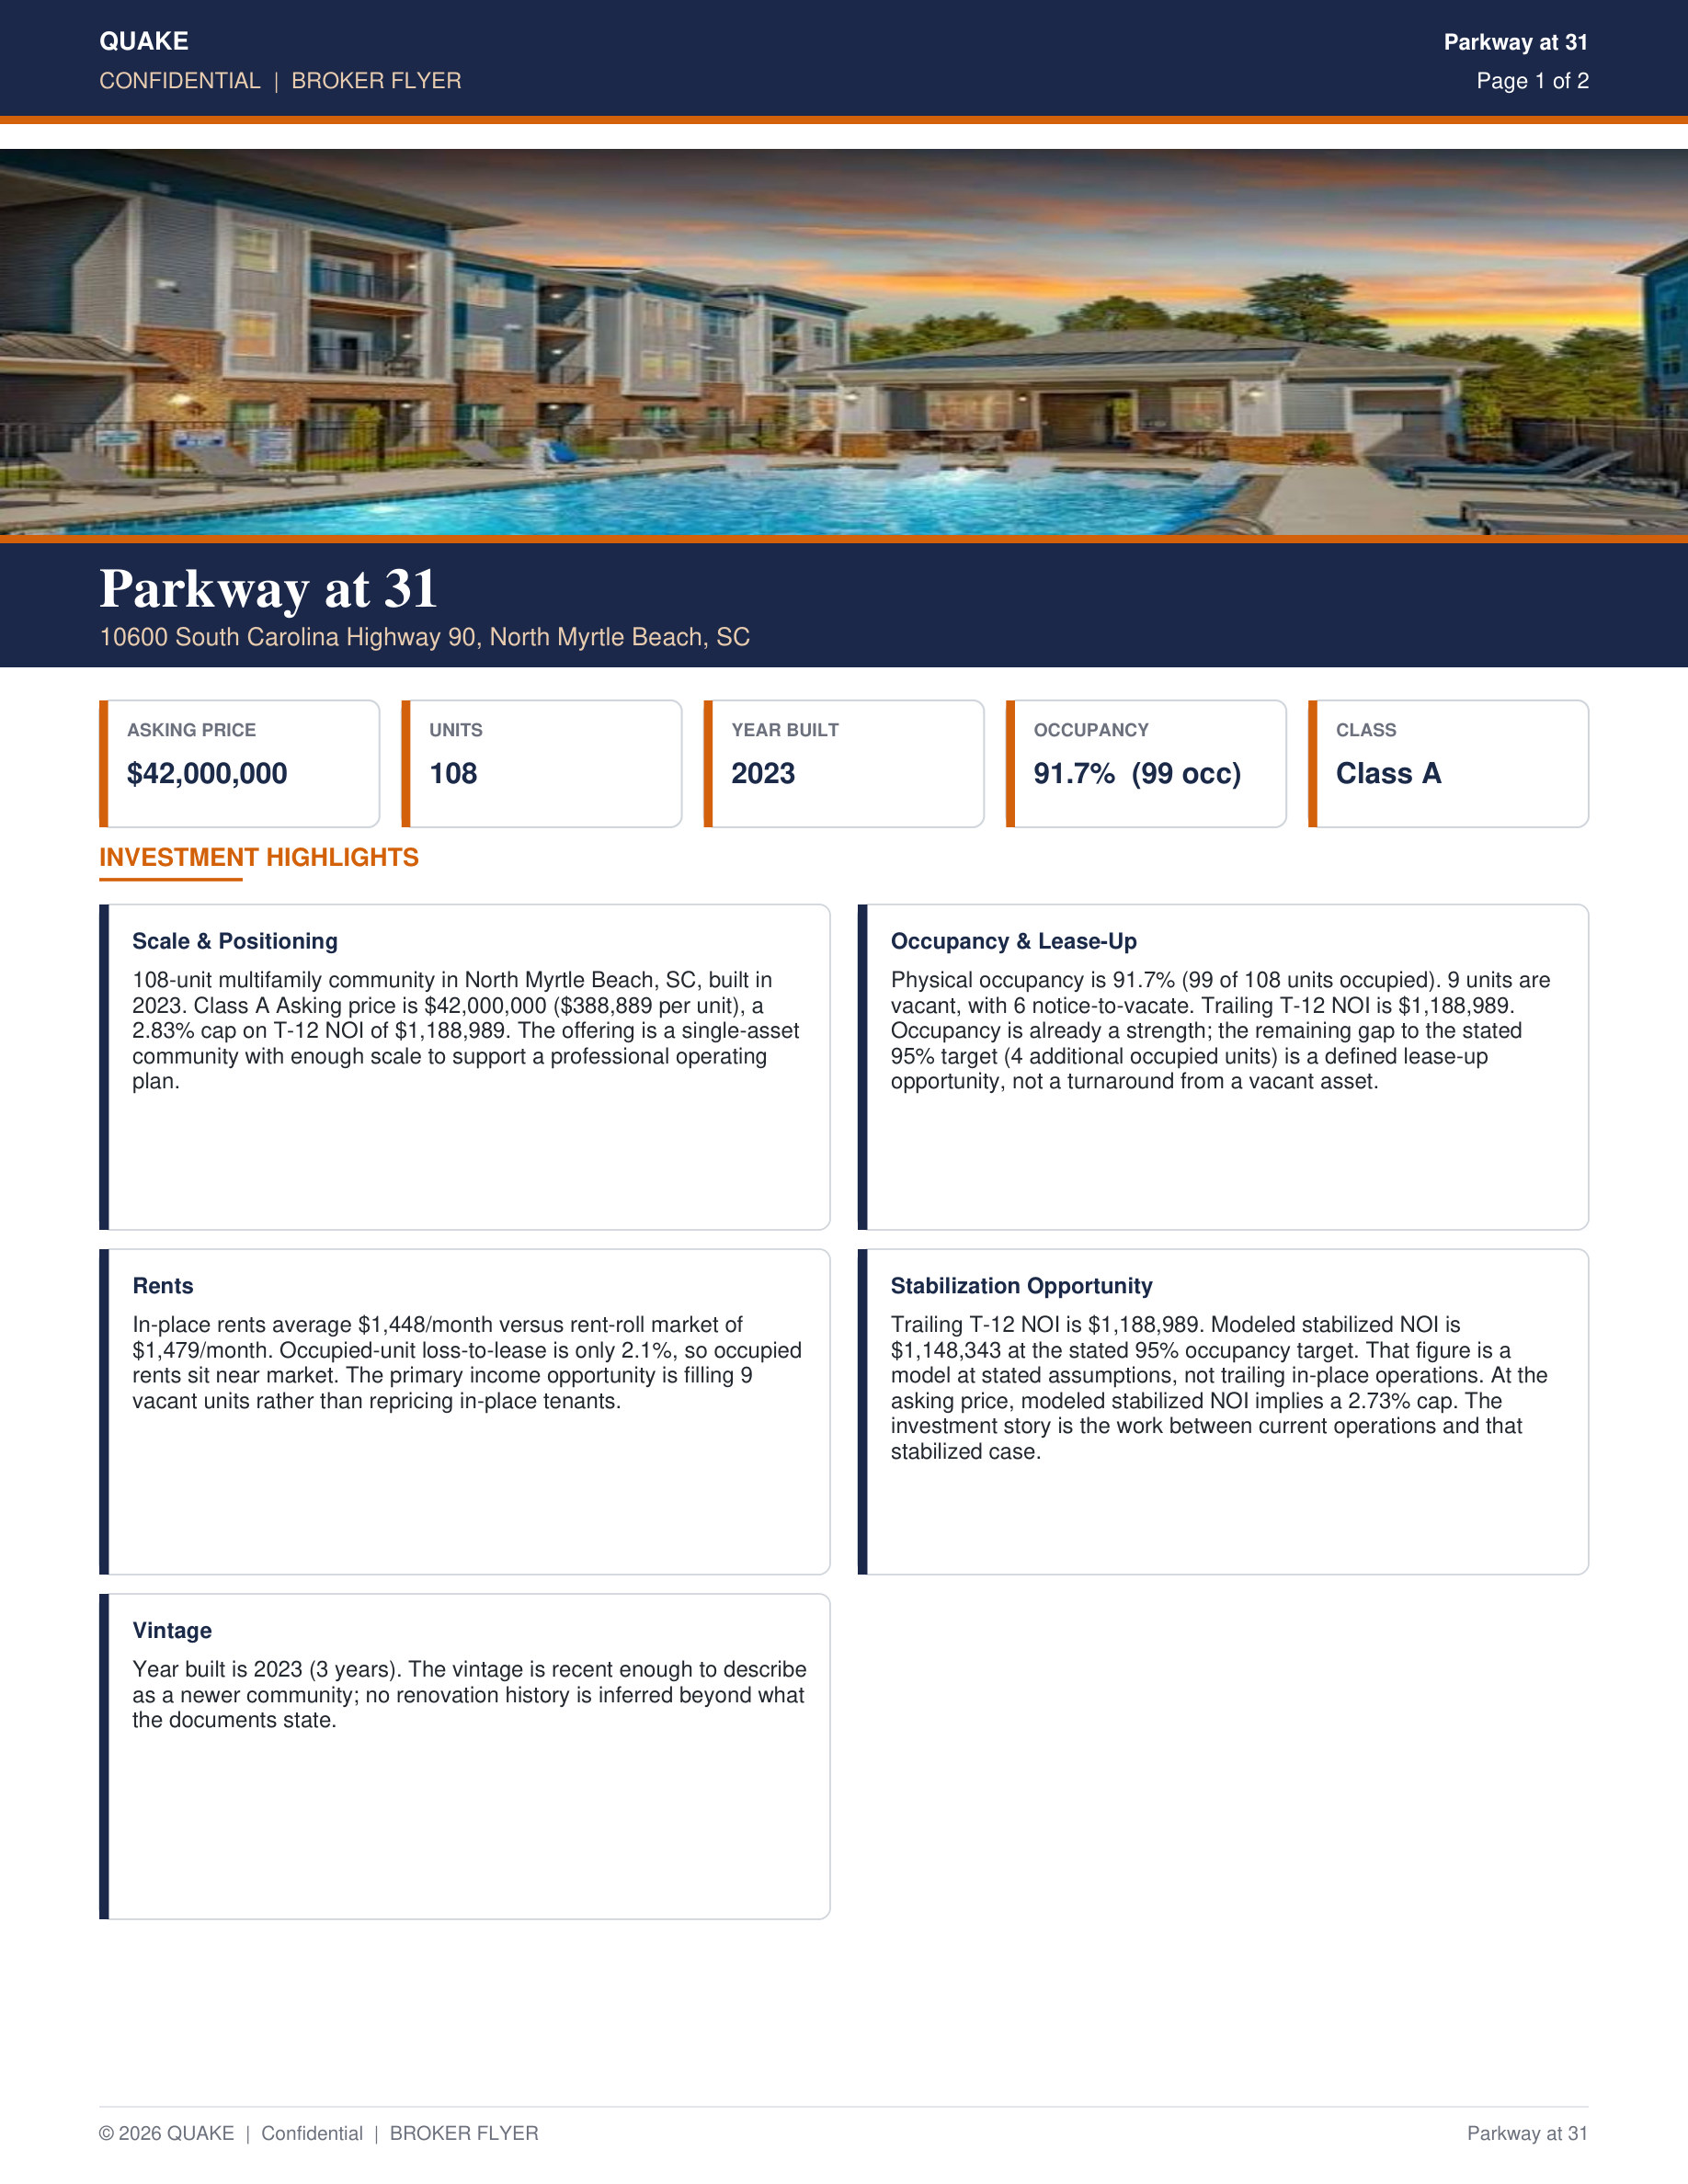
Buyer Report
Broker FlyerCreation
OMCreation
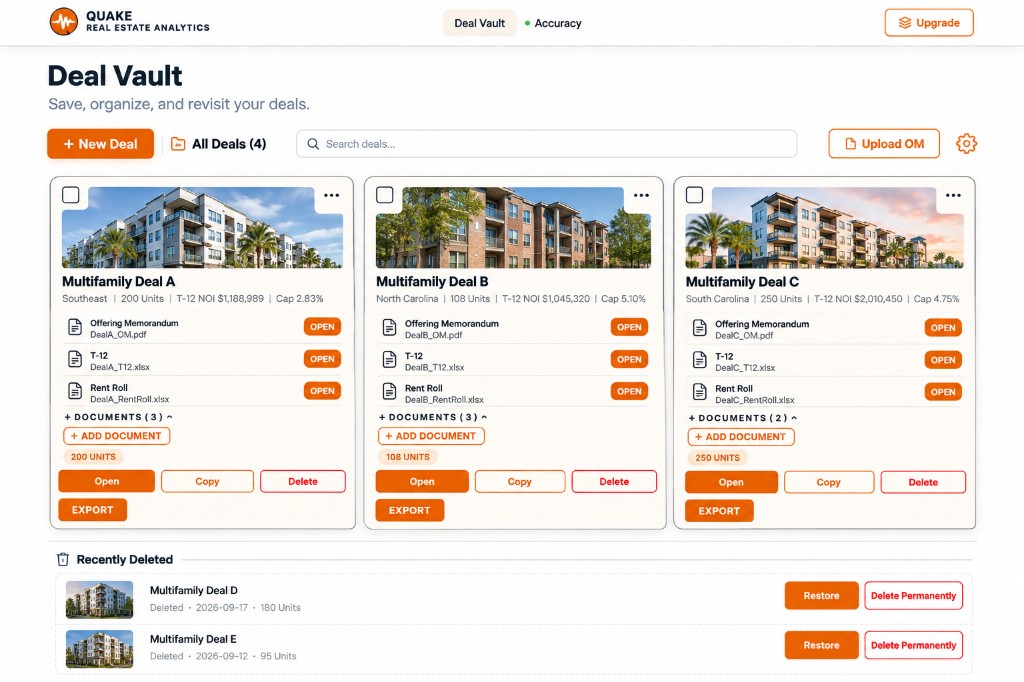
Deal Vault
Every deal. One place. Always ready.
Save and reopen deals. Keep documents, analysis, and reports together. Everything organized and ready when you need it.
Deal Vault
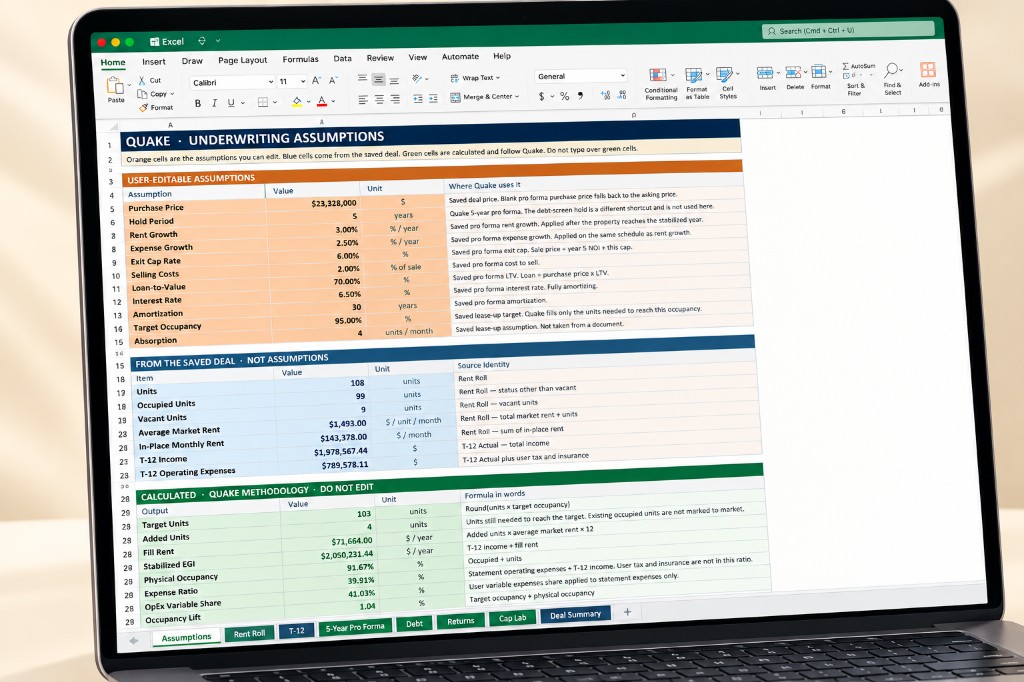
Excel Underwriting
From Quake analysis to a fully editable Excel underwriting model.
Excel Underwriting
Pricing
Start with the deal in front of you.
One platform for the file, the analysis, and the package.
7-day free trial, then
$99 / month
Card required. Billed automatically after the trial unless you cancel. Cancel anytime.
Upload OM, T-12, and rent roll
Deal Index with source-backed figures
Analysis: T-12, rent roll, Cap Rate Lab, value-add, debt, market
Deal Vault, reports, and presentations
Put a real deal in Quake.
OM. T-12. Rent roll. Then the decision.
Set up your profile
Tell us about you
This appears on your broker-ready exports and unlocks role-tailored analytics. You can update or skip anything later.
Your data is stored locally and synced privately to your account. We never sell identified user information.
QUAKE Real Estate Analytics
Vertical AI built for the independent multifamily operator — not the institutional desk.
Plans starting at $99/month. 7-day free trial on QUAKE 10.
AI-powered underwriting for multifamily operators — buyers, brokers, lenders, developers, syndicators, and LPs.
Serious underwriting for commercial real estate professionals.
QUAKE 10 is billed once a year after its 7-day free trial; Unlimited and Ultimate are billed once a year, starting today. Credits are added every month. Prices include any applicable tax.
Your free trial was not started because this email or card has already had a QUAKE free trial. You have not been charged. Choose a plan below; the amount due today is shown on each plan.
$0 today · cancel anytime
QUAKE 10
$99/mo
For professionals underwriting a handful of deals each month. Save up to 10 new scenarios each billing month with QUAKE's core analysis workflow.
+ 10 new saved scenarios each billing month
+ 1,000 AI credits each month
+ Document Intelligence
+ Deal Analysis
+ Debt & DSCR analysis
+ Excel Underwriting
+ Buyer Report (PDF)
+ Deal Vault
What's included
QUAKE 10
10 new saved scenarios each billing month
Every new scenario you save counts as one, including the first scenario of a new property. Changing a scenario you already saved is free. Deleting a scenario does not give one back. Your count starts over at the start of each billing month, and everything you saved before stays in your Deal Vault.
What's included
+ Upload your Offering Memorandum, T-12 and Rent Roll and get the numbers
+ Deal Highlights, Market Analysis, Debt and Cash Flow, Value-Add, and Analyze the Deal
+ Ask This Deal: a limited number of questions each month
+ Deal Vault: save, rename, copy and delete your scenarios
+ Buyer Report (PDF) and Excel Underwriting workbook
+ Download your reports and email them to anyone
+ Send any document saved with your deal
7-day free trial
Try it free for 7 days with up to 10 saved scenarios and 250 AI credits. Same features as QUAKE 10. When the trial ends, QUAKE 10 starts automatically at $99/month on the card you entered, unless you cancel during the trial. If you cancel, your saved work stays viewable.
Due today: $0.00 · then $99/month after the 7-day free trial
7 days free. Card required. Billed automatically on day 8 unless you cancel; cancel any time during the trial. One free trial per person, company and card.
QUAKE UNLIMITED
$299/mo
For active investors, brokers and real estate professionals underwriting at higher volume, with unlimited deals and saved scenarios.
Everything in QUAKE 10, plus:
+ Unlimited deals and unlimited saved scenarios
+ Higher Level Analysis: T-12 line-item check, Rent Roll deep dive, Cap Rate Lab and Pro Forma
+ Full Deal Report (PDF)
+ Compare scenarios side by side, plus Deal Matrix
+ 3,500 AI credits each month
+ More Ask This Deal questions each month
+ Deal Vault spreadsheet export (CSV)
+ Priority email support
Due today: $299.00 · then $299/month. No free trial.
Card required. Charged today when you subscribe, then renews automatically each month; cancel any time.
QUAKE ULTIMATE
$699/mo
For high-volume underwriting. Everything in QUAKE Unlimited, with the largest monthly AI credit allowance and the lowest cost per credit.
+ Everything included in QUAKE Unlimited
+ Unlimited deals and unlimited saved scenarios
+ 10,000 AI credits each month
+ Lowest cost per AI credit of any plan
Due today: $699.00 · then $699/month. No free trial.
Card required. Charged today when you subscribe, then renews automatically each month; cancel any time.
Testing mode — switch plans anytime via the floating badge. No payment required.
FREE
Free
Pro
Elite
Platinum
QUAKE Real Estate Analytics
AI-powered analytics for every property type.
My Role
Pick the role you play in your deals — used across the app
Deal Vault
No deals yet. Create your first deal above.
Recently Deleted
Analysis Tools
Drag tools to reorder
Core Calculators
Property Info
Property details, financials, and unit mix
›
EDR Calculator
Equity dividend rate — return on down payment
›
Cap Rate
NOI ÷ purchase price valuation
›
GRM Calculator
Quick screening by gross rent multiplier
›
Cash-on-Cash
Pre-tax cash flow vs. total cash invested
›
DSCR
Debt service coverage — lender threshold
›
Loan Amortization
Payment schedule, P&I split, balloon balance
›
Seller Net Sheet
Calculate seller's net proceeds after all costs
›
Deal Analysis
Deal Comparison
Side-by-side deal analysis
›
1031 Exchange
Tax deferral, boot, and replacement requirements
›
Pro Forma
Multi-year projection with exit valuation
›
Rent Roll
Unit-level rent analysis and upside
›
Break-Even
Minimum occupancy to cover costs
›
OM Upload
Extract deal data from offering memorandums
›
Expense Ratio
OPEX benchmarks vs. industry standards
›
Market Benchmarks
Live market cap rates, rents, and trends by MSA
›
Comp Finder
Recent multifamily sales comps near your deal
›
Maturity Wall Tracker NEW
Track properties with maturing loans — find motivated sellers
›
Deal Room
Shareable deal page for investors and lenders
›
Demographics
AI-powered market demographic analysis
›
Rent Comp Scanner
AI compares your rents to market rates
›
Marketing Engine
Buyer Database
Manage buyers and match to active deals
›
Flyer Generator
Branded property flyers with 3 templates
›
Email Blast Creator
Send deal alerts to matched buyers
›
Social Media Posts
AI-powered captions for IG, FB, LinkedIn, X
›
Property Microsite
Generate a downloadable deal landing page
›
OM Designer
Create professional themed offering memorandums
›
Glance
One-screen view of your active deal — cap, NOI, $/unit, alerts
›
OM Repair Shop
Audit OM contradictions, compare to T-12/RR, build defensible offer
›
CA / NDA
Generate & track confidentiality agreements
›
Campaign Analytics
Track campaigns, emails, and OM requests
›
Coming Soon
Coming Soon
See what we're building next
›
Dark Mode
Switch to a dark color scheme
Sound Effects
UI sounds and feedback tones
About & Pricing
View plans and upgrade options
Current Plan
Free
QUAKE Real Estate Analytics v3.0
← Back to Dashboard
Property Info
Capture the fundamentals of any multifamily deal — property details, financials, and unit mix.
Property Details
Student housing — beds per property
Financial Overview
$
%
$
$
$
Unit Mix
TypeCountAvg SqFtAvg RentMo. Total
Notes
Deal Snapshot
—
—
Asking Price—
Total Units—
Price / Unit—
Price / SqFt—
Occupancy—
Year Built—
Quick Analysis
Est. NOI—
Cap Rate—
GRM—
Expense Ratio—
Quick links: Use the tools below for deeper analysis.
→ EDR Calculator→ Cap Rate Calculator→ Pro Forma Builder
← Back to Dashboard
EDR Calculator
Equity Dividend Rate measures cash-on-cash return relative to your down payment. Formula: (PGI − Vacancy − OPEX − Debt) ÷ Down Payment
Inputs
$
%
$
$
$
Equity Dividend Rate
—
<0% — Negative
0–6% — Below Avg
6–10% — Average
10%+ — Strong
Calculation Breakdown
Potential Gross Income—
− Vacancy Loss—
= Effective Gross Income—
− Operating Expenses—
= Net Operating Income—
− Annual Debt Service—
= Cash Flow Before Tax—
÷ Down Payment—
= Equity Dividend Rate—
Investor benchmark: Most experienced investors target an EDR of 10%+ for strong cash-flowing assets. An EDR below 6% may indicate thin margins or aggressive financing.
← Back to Dashboard
Cap Rate Calculator
Capitalization rate is the primary valuation metric in commercial real estate. Formula: NOI ÷ Purchase Price
Inputs
$
$
$
%
$
%
Cap Rate
—
<4% — Low Yield
4–7% — Average
7–10% — Good
10%+ — Excellent
Result
NOI—
Purchase Price—
= Cap Rate—
Market context: Cap rates vary by market and asset class. Class A multifamily in gateway cities: 3–5%. Suburban value-add: 5–8%. Smaller markets: 8–12%+.
← Back to Dashboard
GRM Calculator
Gross Rent Multiplier — fast deal-screening metric. Lower GRM means more income relative to price. Formula: Purchase Price ÷ Gross Annual Rental Income
Inputs
$
$
$
$
Gross Rent Multiplier
—
Enter values above
<10 — Excellent
10–15 — Good
15–20 — Average
20+ — Poor
Result
Purchase Price—
Gross Annual Income—
= GRM—
Market note: A GRM of 8–12 is generally favorable in most U.S. markets. High-cost metros (NYC, SF) may have GRMs of 20+, reflecting appreciation over cash flow.
← Back to Dashboard
Cash-on-Cash Return Calculator
Measures annual pre-tax cash flow relative to total cash invested. Formula: Annual Pre-Tax Cash Flow ÷ Total Cash Invested
Inputs
$
$
+ Calculate from NOI & Debt
$
$
Computed Cash Flow—
Cash-on-Cash Return
—
<5% — Below Avg
5–8% — Fair
8–12% — Good
12%+ — Excellent
Calculation
Annual Cash Flow—
÷ Cash Invested—
= Cash-on-Cash Return—
Benchmark: Most investors target 8–12% CoC in stable markets. Anything above 12% is considered excellent. Below 5% may not justify active management risk.
← Back to Dashboard
DSCR Calculator
Debt Service Coverage Ratio — lender qualifying threshold analysis. Formula: NOI ÷ Annual Debt Service
Inputs
$
$
+ Calculate Debt Service from Loan
$
%
Computed Monthly Payment—
Computed Annual Debt Service—
DSCR
—
<1.0 — Below
1.0–1.25 — Marginal
1.25–1.50 — Adequate
1.50+ — Strong
Calculation
NOI—
÷ Annual Debt Service—
= DSCR—
Lender benchmark: Most commercial lenders require a minimum DSCR of 1.20–1.25x. Agency lenders (Fannie/Freddie) typically require 1.25x. Below 1.0x means the property cannot cover debt service from income.
← Back to Dashboard
Loan Amortization Calculator
Compute monthly payments, total interest, and balloon balance for commercial real estate loans.
Inputs
$
%
$
$
$
$
Loan Summary
Principal & Interest (P&I)—
Monthly Taxes (T)—
Monthly Insurance (I)—
Monthly HOA—
Total Monthly (PITI)—
Annual Debt Service—
Total Interest Paid (over term)—
Balloon Balance at Term End—
Loan-to-Value (LTV)—
CRE loan structure: Commercial multifamily loans typically have 25–30 year amortization with 5–10 year terms. The balloon balance is your refinance obligation at term end. PITI is shown if taxes or insurance are entered.
Amortization Schedule (by Year)
Year
Beg. Balance
Annual Payment
Principal
Interest
End Balance
← Back to Dashboard
Deal Comparison Tool
Compare up to 4 deals side-by-side across key investment metrics. The best value in each row is highlighted.
1 deal
Comparison Table
← Back to Dashboard
Pro Forma Builder
Multi-year cash flow projection with income growth, expense escalation, and exit valuation.
Year 1 Inputs
$
%
$
$
$
Projection Settings
%
%
%
%
$
Exit Summary
Year 1 NOI—
Final Year NOI—
Exit Value (NOI / Cap)—
Selling Costs—
Loan Payoff—
Net Sale Proceeds—
Total CFBT (hold period)—
Tip: Exit value = final year NOI ÷ exit cap rate. Use a slightly higher exit cap rate to be conservative in your projections.
Multi-Year Projection
Year
PGI
Vacancy
EGI
OPEX
NOI
Debt Svc
CFBT
EDR
← Back to Dashboard
Rent Roll Analyzer
Enter unit-level rent data, identify below-market units, and analyze revenue upside potential.
Rent Roll
Unit #TypeSq FtCurrent RentMarket RentStatus
Portfolio Summary
Total Units0
Occupied Units0
Occupancy Rate—
Avg Current Rent—
Total Monthly Revenue—
Below-Market Units0
Revenue Gain to Market—
Revenue gain to market shows the additional monthly income if all occupied below-market units were raised to market rent. This represents your value-add upside.
← Back to Dashboard
Break-Even Occupancy
Minimum occupancy rate needed to cover all operating expenses and debt. Formula: (OPEX + Debt Service) ÷ PGI × 100
Inputs
$
$
$
Break-Even Occupancy
—
0%50%80%90%100%
<80% — Healthy
80–90% — Moderate
>90% — Risky
Calculation
Operating Expenses—
+ Annual Debt Service—
= Total Fixed Obligations—
÷ Potential Gross Income—
= Break-Even Occupancy—
Risk assessment: Properties with break-even below 80% can withstand significant vacancies. Above 90%, even modest vacancies may cause cash flow deficits.
← Back to Dashboard
Expense Ratio Calculator
Operating expense benchmarks to validate cost assumptions. Formula: Total OPEX ÷ EGI (or PGI) × 100
Inputs
$
$
Expense Breakdown (Optional)
$
$
$
$
$
$
Sum of Categories—
Expense Ratio
—
0%25%45%65%80%+
<35% — Very Lean
35–45% — Typical
45–55% — High
55%+ — Excessive
Calculation
Total Operating Expenses—
÷ Income Base—
= Expense Ratio—
Industry benchmark: Typical multifamily expense ratios are 35–45% of EGI. Older buildings or those with high utilities tend toward 45–55%. Ratios above 55% warrant scrutiny.
OM Upload moved
Upload Offering Memorandums from your deal page under Upload Documents — this standalone tool page is retired.
← Back to Dashboard
Buyer Database
Manage your buyer contacts, track investment criteria, and match buyers to active deals.
Name
Company
Type
Price Range
Units
Markets
Added
Actions
No buyers yet. Click “Add Buyer” to get started.
Add Buyer
Full Name *
Company
Email
Phone
Investment Type
Target Cap Rate (%)
Min Price ($)
Max Price ($)
Min Units
Max Units
Target Markets (comma-separated)
Notes
← Back to Dashboard
Flyer Generator
Auto-generate branded property flyers from your deal data. Pick a template, preview, and download.
Deal Data
Property Name
City
State
Units
Asking Price ($)
NOI ($)
Cap Rate (%)
Investment Highlights
Template
Live Preview
← Back to Dashboard
Email Blast Creator
Create professional deal announcement emails and send to matched buyers.
Template
Subject Line
Recipients
No buyers in database. Add buyers first.
Email Preview
← Back to Dashboard
Social Media Post Generator
Generate platform-optimized captions and previews for your listings.
Platform
Caption
0 characters
Preview
MF
QUAKE
@multifamilyusa
PROPERTY PHOTO PLACEHOLDER
Your caption will appear here.
← Back to Dashboard
Property Microsite Generator
Generate a standalone branded landing page for any deal. Download as a self-contained HTML file.
Theme
Deal Data
Property Name
City
State
Units
Price ($)
NOI ($)
Cap Rate (%)
Investment Highlights (one per line)
Live Preview
CA / NDA Generator
Generate and track Confidentiality Agreements for your listings.
Property & Broker Information
Agreement Preview
Add Buyer / Send CA Request
CA Tracker
0 buyers
No buyers added yet. Add a buyer above to start tracking CAs.
NameCompanyEmailStatus
Seller Net Sheet
Calculate exactly what the seller walks away with.
Sale Details
Estimated Closing Costs
Seller Net Proceeds Breakdown
Rent Comp Scanner
Compare your rents to market and find the revenue upside.
Property Details
Unit Mix & Current Rents
Unit TypeCountSq FtCurrent Rent
Market Rent Comparison
1031 Exchange Calculator
Calculate tax deferral, boot, and replacement property requirements.
Relinquished Property (Selling)
Replacement Property (Buying)
Exchange Analysis
OM Designer
Six-page institutional offering memorandum. Underwriting values come from the Deal Index.
Optional — load a saved deal
Only needed for a deal you already saved to Deal Vault. Coming from Create Presentation? Fields should already be filled — pick a theme and tap Generate.
Reloads identity and KPIs from the Deal Index. Does not pull raw T-12 or Rent Roll over Deal Index values.
OM Credits: 1 remaining this monthAdditional OMs: $39 each
Select Theme
Phase 1 Offering Memorandum uses institutional navy and orange regardless of theme. Theme swatches are preserved for a later pass.
Property Details
Units, occupancy, asking price, NOI, cap, year built, and average rent are locked to the Deal Index. Missing values print as n/a — Action Required. Edit them on the deal, not here.
Story, amenities, and offering
Property photographs
Assign photographs you own or have rights to use. Each box maps to a specific page in the Offering Memorandum. Type a caption under a photo to print that wording on the OM; leave it blank to keep the default slot name. Empty slots are left out of the photo layout. Quake does not pull listing-site photography.
Maps
Page 3 — Pricing & Unit Mix. These are layout positions only. Upload an image if you have one; a map provider is not connected yet. Captions print under each position and can be changed later (for example Location Map or Aerial Map).
Property NameSale PriceUnitsPrice/Unit
Broker Information
Coming Soon
New tools in the pipeline. We're building these next.
AI Investor Pitch Deck
One-click polished investment summary PDF with property overview, financials, demographics, value-add opportunities, and deal restructuring plan.
Elite
AI Deal Alerts
Set your criteria (market, units, cap rate, price) and get notified when matching deals hit the market. AI pre-screens and ranks every listing.
Elite
Insurance Cost Estimator
AI estimates property insurance based on location, age, construction type, units, and flood zone. Ballpark before due diligence.
Pro
Closing Cost Calculator
Detailed buyer and seller closing cost breakdown by state, including title fees, transfer taxes, recording fees, and lender charges.
Free
Have a feature request?
We build what our users need. Reach out and let us know what tool would help your business.
← Back to Dashboard
Campaign Analytics
Track your marketing campaigns, buyer engagement, and outreach performance.
Total Buyers
0
In database
Active Campaigns
4
This month
Emails Sent
247
Last 30 days
OM Requests
18
Conversion: 7.3%
Campaigns by Month
Buyer Types
Recent Activity
Date
Event
Property
Contact
Channel
← Back to Dashboard
Market Benchmarks
Real-time multifamily market data by MSA — cap rates, rents, vacancy, and trends powered by AI.
Select Market
Market Summary
How Does My Deal Compare?
Enter deal data on the Deal page to see a comparison.
Fetching market data from Perplexity Sonar…
← Back to Dashboard
Comp Finder
Recent multifamily sales comps near your subject property, powered by AI search.
Search Parameters
Searching for recent sales comps…
Comparable Sales
← Back to Dashboard
Shareable Deal Room
Generate a professional, self-contained deal summary page to share with investors, lenders, and clients.
Drop your most important documents here — AI will extract and analyze the data automatically
One PDF with all three? Drop it on Offering Memorandum — we’ll detect the bundled T-12 and Rent Roll automatically.
Tells the AI which export format to expect. Leave on Auto-Detect unless extraction misses fields — then pick the system the file came from.
Offering Memorandum
PDF only
✓ Uploaded
Trailing 12 (T-12)
Excel preferred
✓ Uploaded
Rent Roll
Excel preferred
✓ Uploaded
Cross-check the extracted data against your source documents
AI Deal AnalysisAI Deal AnalysisReview the key numbers, then analyze the deal, generate the report, or export and share.
Review key numbers, then analyze
Property Status:
$
$
$
New Deal
Create a new deal folder with property details and supporting documents.
✓ Deal saved successfully
Property Type
Multifamily
Apartments, Condos
Retail
Strip, Shopping Center
Industrial
Warehouse, Flex
Office
Class A/B/C
Mixed-Use
Retail + Residential
Hospitality
Hotel, Motel
Self Storage
Storage Facilities
Land
Development, Lots
Land Valuation
Price / Acre
—
Price / SF
—
Total Acreage
—
Zoning
—
Deal Contacts
Key Financials
$
$
Property Status:
T-12 actual income — GPR prorated from occupancy
Prorated GPR:—
When to use each:
• Stabilized — property is leased up (95%+ occ) and the trailing-12 income is representative. Underwrite cap rate off the T-12 NOI.
• Lease-Up — building is still filling up. The trailing-12 understates run-rate. The Lease-Up Analytics card (further down, under the Rent Roll panel) lets you set target occupancy, absorption / mo, and annual OpEx. Cap Rate Lab then values the property off the stabilized projection, not the partial-year actuals.
$
%
$
$
Loan Details
Quick guide: For a regional / community bank loan, choose Bank / Portfolio. For agency debt (Fannie / Freddie), pick the agency. CMBS is Wall Street conduit. Bridge is short-term value-add. Life Company is for trophy assets.
$
$
%
Calculated Annual Debt Service:—
Tax Assessment
Current vs projected post-sale · reassessment risk
$
Pulls from T-12 property_taxes if available
$
Look up on county assessor site
%
Current Tax ÷ Current Assessed (mill rate)
How does the county reassess at sale?
$
Post-Sale Tax Projection
Pro Forma
Auto-runs 1–5 years · cash flow, IRR, equity multiple
Purchase price, financing, and exit assumptions are in the 5-Year Proforma bubble under Higher Level Analysis. Results below update as you edit those fields.
AI Deal Summary
Broker-ready executive summary
Data Sources
○APOD (Projected)Not uploaded
○T-12 (Actual)Not uploaded
Use for calculators:
Deal Snapshot
Data Room
Upload and view every document for this deal. 0 of 11 due diligence items.
0 of 11
NotesNotesDeal notes, observations, and next steps. Saved with this deal.